
The McKeesport Natural Gas Boom, 1919-1921
Carnegie Mellon University
nzm[at]andrew.cmu.edu
Carnegie Mellon University
Jt03[at]andrew.cmu.edu
Cet article examine le boom éphémère du gaz naturel dans la région de McKeesport, en Pennsylvanie (Etats-Unis). La découverte et l'exploitation des ressources de gaz naturel se caractérisent souvent par un cycle d'expansion et de récession où un afflux d’investissements et une augmentation de la production sont suivis par l'épuisement des réserves et la chute des prix. Le cas de McKeesport ne fait pas exception. Il est toutefois particulièrement remarquable du fait de l'essor rapide de la production au niveau du grand puits initial et de son effondrement tout aussi brutal, en raison de la proximité du forage et du comportement grégaire des foreurs. Les foreurs et les investisseurs n'ont pas tenu compte des avertissements des experts concernant les limites des réserves. Un legs durable du boom de McKeesport est le risque environnemental de long terme lié aux puits abandonnés. Les leçons tirées de cette analyse du boom de McKeesport peuvent guider les régulateurs environnementaux actuels face aux promesses de ressources inépuisables en gaz naturel.
Introduction
Natural resource extraction often follows a boom-and-bust cycle. A new discovery or technological innovation leads to a rush of investment and production. In time, falling prices or dwindling reserves result in stalled activity. The cycle repeats with new discoveries, innovations, or rebounding prices. One such event, triggered by discovery of a major natural gas well, occurred in the McKeesport area just south of Pittsburgh, Pennsylvania from 1919 to 1921. While natural gas booms were not necessarily unique, the McKeesport boom was especially dramatic not only because of the production of the initial big well but also short-lived because of the closeness of the drilling and herd behavior of the drillers. As the unusual and detailed quantitative historical record shows, the gusher erroneously convinced property owners and investors alike that exorbitant profits awaited the investor who sunk the next well. The rush was on.
The present paper uses a unique database, digitized from historical field performance data, to quantify the frenzy. More specifically, a detailed production chart first published in the February 1921 issue of Natural Gas, a trade journal, has been digitized for the quantitative analysis executed in this study. These data include daily and total field production, as well as the number of dry, producing, and total wells. This dataset provides a unique, micro-level depiction of the performance profile of the field and evidence of its rapid exhaustion. Within the current generation, the Pittsburgh region is experiencing a boom in natural gas production caused by the application of hydraulic-fracturing and horizontal drilling technology.1 This more recent episode is far larger in scope and its consequences, both financial and environmental, considerably more far-reaching.
Though the two episodes are separated by nearly a century, and they differ in important ways, this article emphasizes three features of the McKeesport boom that may help inform present decision-making. First, we document the extent to which herding behavior, rather than reasoned investment, governed decision-making during the McKeesport boom. This involves three points. The rate at which new wells appeared in the field was associated with recent drilling, whether the recent wells were successful or not. (This aspect of the analysis is enabled by the new, digitized data noted above.) Even early in the boom, cost and revenue estimates suggest the rate of return on new wells was negative. And, official forecasts by state geologists of the field’s limited capacity and short remaining life were ignored.
Second, we argue that land use, specifically densely sub-divided land, exacerbated over-investment. Drilling decisions by individual leaseholders and landowners neglected the negative depressurization externalities that coordinated management could have avoided. Third, the McKeesport boom left an enduring environmental hazard in the form of orphaned wells. In the throes of the frenzy, considerations of long-term impact were absent. All three of these features have clear connections to the present.
Other boom and bust cases of natural gas development reinforce the conclusions of this paper regarding exaggerated forecasts of future supply, disregard of expert warnings, concern over site development, the failure of governmental regulation and improper capping plugging of wells, leading to methane leakage.
Back to topNatural Gas in Pennsylvania and the McKeesport Pool
The discovery and exploitation of natural gas in the Pittsburgh region began in the late 1870s and extended into the 20th century. Drillers seeking oil and salt in the northwestern corner of Pennsylvania had discovered natural gas in the 1860s and occasionally used it to heat boilers and power drilling equipment. However, gas was largely flared, or burned off, because of a lack of demand. In the mid-and-late 1870s, drillers found substantial gas supplies in Butler, Armstrong, and Clarion Counties closer to industrial users. Iron manufacturers in the Pittsburgh region began bringing gas into their mills by pipeline. The use of natural gas rather than coal to provide heat had cost and convenience advantages, and other mills and glass works soon followed.2
In the late 19th century, Pennsylvania was the largest producer of natural gas in the nation. In the 1880s, drilling for natural gas increased throughout the state with most wells located in southwestern Pennsylvania where geological features were conductive to the pooling of gas. By 1897, there were 2,467 gas wells in the state operated by 176 producers: a number that increased to 12,255 wells with 1,174 producers in 1913. The state reached its maximum total gas production in 1906, a year when residential and industrial consumption exceeded state production. Intuitively, prices rose. In 1906, the average price per thousand cubic feet of natural gas was 13.4 cents. It increased to 18.25 cents in 1913, as demand continued to exceed supply.3
Many of the wells drilled in western Pennsylvania were located in the Pittsburgh Quadrangle, a geological area of 227 square miles that includes most of southeastern Allegheny County and small sections of Washington and Westmoreland Counties. Drillers included both small operators and large, such as the Philadelphia Company, the Peoples Natural Gas Company, the Carnegie Natural Gas Company and the Manufacturers Light and Heat Company. These firms sought oil as well as natural gas. Extensive drilling in this quadrangle took place in the late 19th century and into the 20th but declined considerably because of lower prices. After approximately 1912, however, and after the beginning of World War I in 1914, gas prices increased as did the pace of drilling.4
Natural gas is commonly associated with anticlines, roof-shaped folds of the containing rock. The McKeesport gas pool was located on the Murrysville anticline and was part of the historically productive Murrysville field. Natural gas and oil deposits are located in what geologists called sands, some identified by the name of the sand’s discoverer. The most productive sand in this anticline was the Speechley sand. This deposit was between 20 and 50 feet thick, located at a depth of 2,325 to 3,000 feet. It had a porosity of approximately 5 to 18 per cent.Between 1915 and 1919, extensive gas drilling developed in several western Pennsylvania sands including the Speechley, Hundred-foot, Murrysville and Elizabeth sands in North Versailles Township and Versailles borough in Allegheny County. Drilling in the deeper Speechley sand began in 1919.5
Back to topDrilling, Field Production, and Herd Behavior
On April 19, 1919, the Philadelphia Company, a major natural gas utility, was drilling on a farm in the Snake Hollow district of North Versailles when it struck a well that initially produced approximately 1,500,000 cubic feet (cf) of gas.6 While a large producer, this well was soon exceeded in production by the “Big Well,” drilled on a nearby site on August 23, 1919 by wildcatters David A. Foster and Samuel J. Brendel. The Foster and Brendel well struck gas at 2,239 feet and had an initial production of 4,000,000 cf per day, increasing to a maximum of 56,117,000 cf. The well was quickly connected to the nearby pipeline of the Peoples Natural Gas Company at a contract price of 17 cents per thousand cf, reducing the amount of wasted gas. In November of 1920, over one year after it was sunk, about one third of the total gas extracted from the McKeesport pool had been produced by the “Big Well.”7
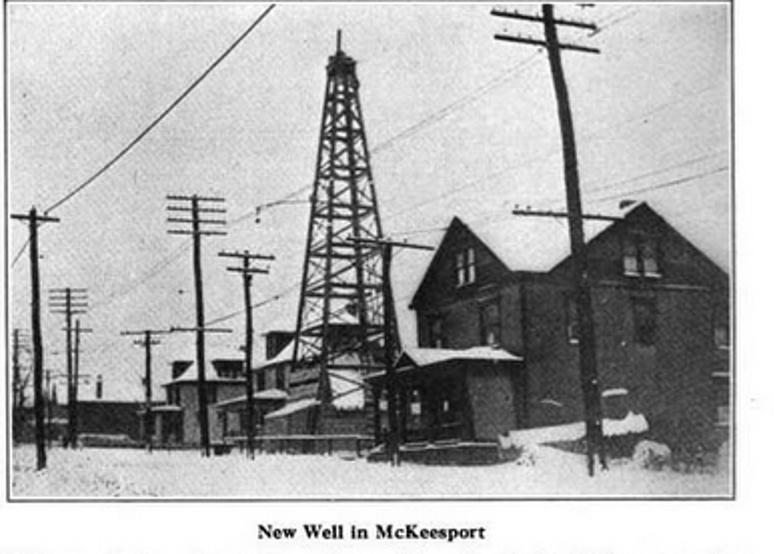
The magnitude of the gas produced by the “Big Well” and several other nearby wells was especially significant because of a national fuel crisis provoked by World War I and a growing natural gas shortage. In late 1918 the Public Service Commission of Pennsylvania published a report on the “Present and Prospective Supply of Natural Gas Available in Pennsylvania”. This report warned that demand for gas from both domestic and industrial users was increasing as the volume of gas from producing wells declined and fewer new wells were drilled.8 In the context of rising gas prices and reduced supply, the discovery of the “Big Well” set off a frenzy of wildcat drilling in North Versailles, Versailles, and other townships in the McKeesport region. (Figure 1 shows the density of drilling in McKeesport.)
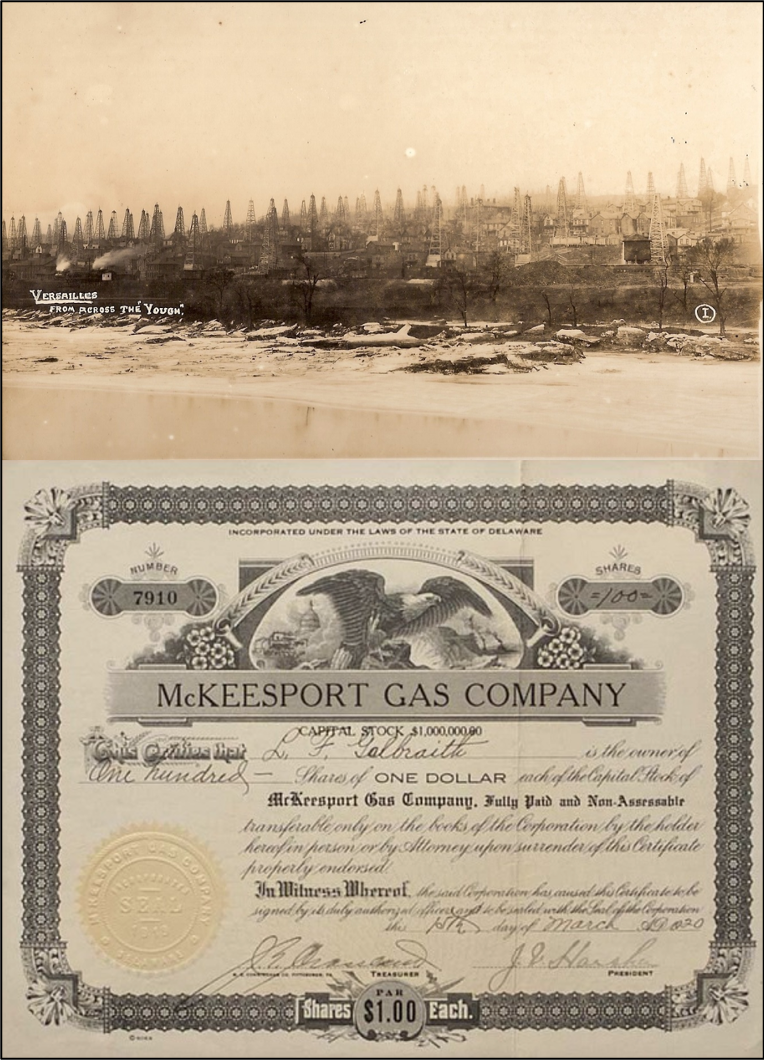
Source: Top Panel: McKeesport Historical Society. Bottom Panel: “McKeesport Natural Gas Boom and Stock Certificate,” used with permission of the American Oil and Gas Historical Society.
William Alvin White wrote in Collier’s Magazine that “Instantaneously and simultaneously every person became gas crazy” as an epidemic of “gas fever” spread throughout McKeesport and beyond.9 Hundreds of companies selling gas stocks formed, and they marketed securities in barbershops, department stores and on street corners (see figure 1). The Pittsburgh Post-Gazette wrote that “scores of bunko men and clever swindlers” selling gas stocks were operating in the city. By Jan. 10, 1920, 297 companies had been formed to drill in this district. Churches and school boards leased land for wells and large sums were offered for leases a mile or so from the gusher. Two daily newspapers focusing on gas issues began publishing in McKeesport and a weekly gas magazine started in Pittsburgh.10
Back to topDeterminants of Drilling
To quantify drilling and extraction behavior, figure 2 plots three time series: the number of productive, dry, and capped wells. These data are a digitized version of Chart No. 1 from Natural Gas of February, 1921.11 From the summer of 1919 until the spring of 1920, there were fewer than 50 dry and producing wells. Drilling then ramped up quickly. By the summer of 1920, over 300 wells had been drilled. By late 1920, there were more than 600 wells, with roughly one-third producing and the remainder dry. Ominously, from April of 1920 onward, the rate of increase in additional dry wells far exceeded that of successful wells. Further evidence of the futility of drilling evinces in the rate of increase in the number of capped wells. In the late spring of 1920, the count of capped wells surpassed that of both dry and productive wells. From autumn of 1919 onward, the rate of successful wells in the McKeesport pool was lower than the statewide average success rate for Pennsylvania between 1908 and 1913.
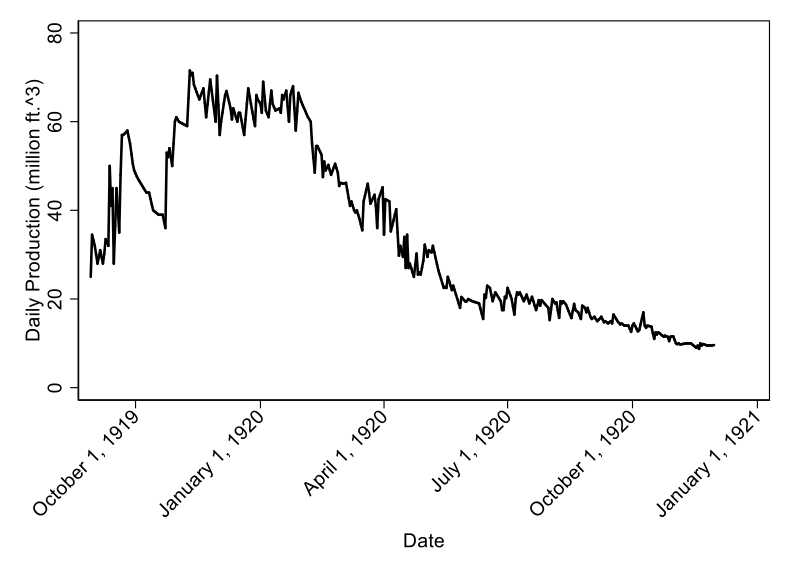
Figure 3 plots the daily production from the field. In 1919, daily production increased, with some variation, as the few new wells drilled were productive. However, production quickly plateaued at about 60 million cf. This level of output was maintained for only a few months, before daily yield dropped precipitously. By the summer of 1920, production was roughly 20 million cf. More modest declines in production occurred throughout 1920 to 1921. Combining figures 2 and 3 reveals that average production dropped even more rapidly, as daily production fell while the well count climbed.
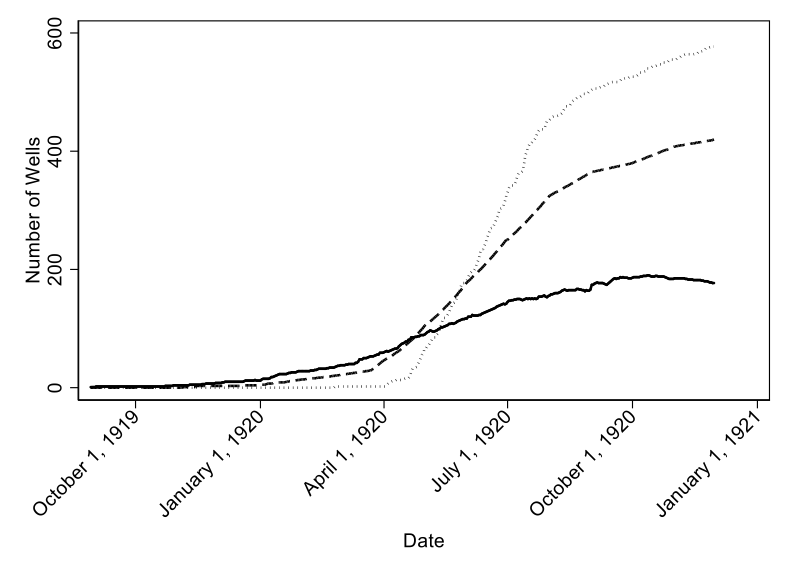
Solid: Producing Wells.
Dash: Dry Wells.
Dot: Capped Wells.
Source: Natural Gas, 1921; Authors’ calculations.
The data plotted in figure 2 are next used to explore the determinants of drilling. Table 1 reports the results of a series of regression analyses intended to characterize the factors affecting the field-wide well count. The models employ first-differenced data because the well series exhibit non-stationarity over the approximately 450-day sample period. All three series are stationary in first-differences, which enables inferences as to the relationships among the series (see table 1).
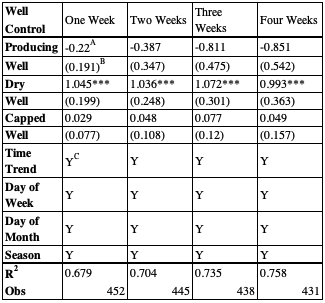
A = sum of coefficients over lags of length indicated in each column heading.
B = robust standard errors in parenthesis.
Dependent variable is first difference in total wells drilled.
All well controls first-differenced.
* = p < 0.10; ** = p < 0.05; *** = p < 0.01.
Each of the models control for time trends, and effects specific days of the week, and the days of the month during which drilling occurred. Of central interest is how the well count on a particular day (t) corresponds to lagged measures of drilling activity. The columns in table 1 correspond to different lag lengths for measures of both producing and dry wells. For example, column (1) includes the count of producing, dry, and capped wells within the past week. This model shows that the number of recently drilled productive wells (those drilled within the last week) has no significant effect on whether new wells are drilled. The negative sign on the productive well coefficient is particularly interesting. This may suggest that a new well sent a discouraging signal to market participants. Perhaps recognizing the finite nature of the field, a new “wet” well implied an incremental reduction in the likelihood of hitting the next gusher.
In contrast, the number of dry wells does significantly affect the count of new wells (p < 0.01). The coefficient suggests that for every one dry well sunk in the past week, investors were likely to drill an additional well. This result reveals an important aspect of investor and driller behavior. Simply the fact that others were sinking new wells into the field stimulated additional drilling. More dry wells meant that the next big strike could still be on the horizon. To make that strike, one simply had to keep drilling.
The remaining three columns of table 1 reinforce this finding. When the lag length is extended to two, three, and four weeks, the same result holds. New productive wells did not significantly influence the decision to drill. Dry wells did. An additional failed investment (a dry well) erroneously bolstered investors’ sense of their chance of hitting the next gusher. These econometric results convey the essence of the race that characterized the boom.
Back to topCosts, revenues, and the rate of return on wells
The preceding sections demonstrate that the majority of wells drilled after June of 1920 were not productive. This section collects available cost and pricing data and combines that with the production data in figure 3 to estimate the time needed for investors to break even on investments in drilling. Here, we use the average productivity of a well and calculate the total revenue as the product of the price of gas times average daily production. We then report when total revenue equals initial cost. This clearly differs from the perspective of market participants. For example, drillers may have estimated investment recovery periods assuming average productivity at the time of drilling would continue at that level into the future. This stands in contrast to actual production subsequent to drilling which, as figure 3 shows, fell quite quickly throughout much of the sample. Because of a lack of available data, we assume zero variable cost. As such, these estimates are biased downwards. That is, our estimates will tend to suggest shorter than actual breakeven times.
Source: Natural Gas, 1921; Authors’ calculations.
The initial costs of the first wells were relatively low – the “Big Well” cost approximately $8,000 and many of the early wells cost less than $15,000. As drilling increased, however, drilling contractors doubled and tripled their fees as the boom increased. By January 1920, most wells were capitalized at between $30,000 and $40,000.The gas was sold at prices from 10-18 cents per thousand cf with an estimated average of 15 cents.12
Figure 4 shows the estimated time to recovery of fixed cost. The left panel focuses on the first four months of data. From late August, 1919 to January 1920, at a capital cost of $8,000, payback took less than one month. Even assuming the much higher investment cost of between $30,000 and $40,000 per well, during the early life of the pool, payback occurred in under two months. Despite these seemingly promising conditions, state geologist George H. Ashley predicted that wells sunk after January 1, 1920, four months after the initial gusher, would not produce enough gas to pay dividends.13
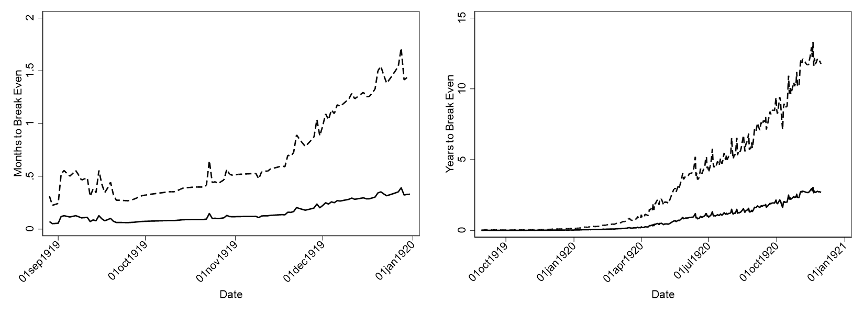
Left panel: months to zero net revenue assuming high fixed costs (dashed line) and low fixed cost (solid line).
Right panel: years to zero net revenue assuming high fixed costs (dashed line) and low fixed cost (solid line).
Source: Authors’ calculations.
The right panel of figure 4 encompasses the full 450-day time series. Using the high capital cost assumption suggests that payback times had stretched to over 5 years by June, 1920. For wells drilled later in 1920, breakeven would not have happened until over ten years. Given that the effective life of the field ended prior to the projected payback period, the rate of return on such wells drilled late in the field was assuredly negative.
It is highly unlikely that rational investors would have elected to keep sinking wells given these market conditions. These data build the case that reasoned balancing of probabilities, benefits, and costs did not have an appreciable role in extraction decision-making. Market participants were in the throes of a frenzy.
The gross inefficiency of this behavior is best summarized in the following way. J. French Robinson, former state geologist and later geologist for the Peoples Natural Gas Company, estimated in 1925 that the field’s total production, with the aid of pumps, was 21 billion cf. Using the estimated average price of 15 cents, the total value of gas extracted was $3,500,000. The estimated cost of drilling the roughly 600 wells in the digitized data averaged out to approximately $13 million dollars.14 This immense loss to investors in the field was concentrated among those who were latecomers. One natural gas expert noted that over-drilling had resulted in twenty times the amount of money being spent that was necessary to develop the field.15 Clearly, the productive labor and capital deployed after the middle of 1920 would have been better used elsewhere.
It is of interest to know how the McKeesport experience influenced natural gas markets at the time of the boom. For instance, an extraction pattern characterized by boom-and-bust rather than steady rates of production may yield excessive price volatility which would adversely affect consumers and investors. Unfortunately, we lack the fine-grained pricing, production and cost data (beyond McKeesport) to quantitatively determine whether the boom affected prices, exploration, and investment in other fields. We can reasonably conclude that gas prices in and around the Pittsburgh market were affected. This claim rests on two facts. First, extraction from the “Big Well” comprised an appreciable share of regional production. And two, is quite likely that the large quantity of gas produced in the early days of the boom would have alleviated the supply shortage experienced by both domestic and industrial consumers.
The present analysis demonstrates how one well influenced drilling behavior within the field. We cannot conclusively say how McKeesport affected investment in other fields. However, news of the “Big Well” did reach national media markets. Hence, there was at least the potential for broader effects on the supply-side of the natural gas industry.
Back to topThe Role of Experts
Rampant drilling occurred despite attempts from government experts to manage the boom. State Geologist Ashley noted that properly drilled wells should be on sites of 80 acres or more and warned in both state reports and the newspapers in November and December of 1919 that over-drilling would exhaust the gas field in less than two years. In a report published in late November, 1919, Ashley noted that “the practice of punching the sand as full of holes as a colander” would accelerate the inevitable decline of the field. This warning seems to have been, according to Ashley, either “overlooked or purposely suppressed”. A statement implying that the field might last “a dozen or a score of years” replaced it.16 Ashley again predicted that subsequent wells would result in significant financial losses. He buttressed this prediction with pressure measurements from the pool showing declines of roughly five pounds per day.17
Despite this official guidance, within a period of fifteen months after Ashley’s warnings over 600 wells were drilled in an area that ten could have drained. Many in the gas business questioned Ashley’s predictions, noting that he had failed to anticipate the boom and was possibly wrong in his predictions regarding its longevity.18 However, while some of the early wells were productive, most were quickly exhausted as maximum daily output of the field at around 70 million cf was maintained for only about one month. Even with productive wells, the forecasted production was usually double the actual production. This fact underscores the apparent divergence between our calculations of the time to investment recovery and the records showing continued rampant drilling. Hence, Ashley’s predictions, while both ignored, and derided, were borne out, leading the most prominent journal in the field, The Gas Age, to note that, “It doesn’t do to laugh at the experts, who generally have the last laugh.”19
The preceding three subsections make clear the inefficiencies and irrational behavior associated with the McKeesport boom. The first conclusion drawn from the McKeesport experience relevant to decision-making today is that initially high returns to investment can so enthrall market participants as to seemingly suspend rational choice. State Geologist Ashley, in his report of January, 1920, described McKeesport after the first major strike as having a “wild-west stock selling boom.” Pittsburgh newspapers were filled with ads for gas stock, with promises of “phenomenal returns on small investments”.20 The returns to the “Big Well” convinced investors that the next mother lode was there for the taking, new dry wells somehow meant greater chances for success; that negative net revenue did not matter; and that expert advice was wrong. In short, the behavior of market participants in the McKeesport boom argues for a robust regulatory role in natural resource extraction. Allowing market forces to operate in an unfettered fashion led to huge financial inefficiencies.
Back to topThe Role of Land Use
One of the unusual characteristics of the McKeesport site was that in the previous three decades much of the land near the location of the “Big Well” had been subdivided into small lots (see figures 1 and 5), often only 25 feet wide, and sold at low prices. Much of the Speechley Sand was located in the township of North Versailles, and Allegheny County real estate records show that of the 5,293 total building lots recorded in the 8.03 square mile township of North Versailles in 1936, 3,980 had been recorded between 1896 and 1915. Only 23 were recorded from 1916-1925, suggesting heavy residential subdivision and building before the gas boom.21 This land use context contributed to the over-investment in the field in two ways. First, the autonomy of multiple landowners meant that no one manager or firm optimized efficient investment and extraction decisions at the pool level. The externality imposed by each additional well in terms of lowered pressure and reduced yields was ignored. Had drilling occurred on much larger plots (as in a rural setting) it is likely that fewer wells would have been sunk. Multiple wells on larger plots would internalize the costs of lowered pressure, decreasing the incentive to drill. This would mitigate pool-level inefficiency.
Second, wells drilled in close proximity to one another meant that new wells were common knowledge. Derricks were visually obvious (see figures 1 and 5). Fear that one’s neighbor might hit the next big well no doubt fueled the rush particularly given the adherence to the Rule of Capture in Pennsylvania. This controversial but widely accepted rule in the U.S. maintained that the owner of a tract of land acquires title to the oil and gas produced from wells drilled there but not to the oil and gas that migrates to an adjacent location.22
Source: Jennings, E. C., “Newton Gets the Gas Fever,” The Gas Age, 1920, 130.
The influence of Foster and Brendel’s “Big Well” cannot be overplayed. The success of the “Big Well” resulted in gas companies, both new and old, frantically seeking leases on nearby sites. With no overarching management, the 864-acre Speechley sand began to resemble a pincushion of derricks with the more than 600 wells averaging 1.3 acres per well. Close proximity to a producing well, however, did not guarantee gas, since the Speechley sand lacked connectivity of its pools and uniformity of its reservoirs.23 Hence, as depicted by figures 2 and 3, the vast majority of wells drilled subsequent to Foster and Brendel’s well were unsuccessful.
Herein lies the second important lesson drawn from the McKeesport experience for current decision-makers. Allowing unmanaged extraction in dense urban or suburban land uses is especially likely to yield inefficient extraction and significant external cost.
Back to topEnvironmental Effects
The state of Pennsylvania began regulating natural gas drilling to a limited extent in the Natural Gas Act of 1885. Companies organized under the act had the right of eminent domain. The Act contained specific terms regarding the sealing and plugging of abandoned wells, with a $200.00 fine if the regulations were not followed. While no governmental agency was tasked with its enforcement, the Act provided that if a well was left unplugged the owner of adjacent lands or “in the neighborhood” of the well could plug it at the cost of the original owner. The motivation for this feature appears to have been to avoid waste and to prevent flooding of adjacent wells. In 1891, the state legislature passed another act requiring the plugging of wells that were abandoned or not operating. Violation of the act was a misdemeanor. In 1921, the legislature passed further legislation regarding plugging well and protecting existing wells from water entering from new drilling.24
Little enforcement of these regulations seems to have taken place. The rapid expansion of well digging in the McKeesport pool resulted in a failure by many companies to satisfactorily case their wells. Many wells flooded with water. Other drillers who found only limited gas abandoned their wells and neglected to plug them according to state law. Gas leakage fouled the air and well fires were frequent.25 By the end of the period under examination, Pennsylvania natural gas production was sharply down.
An enduring legacy of the McKeesport boom is continued methane leakage from well sites, pipelines and other gas appliances. The current concerns are two-fold: methane is a potent greenhouse gas, and continued leaks pose safety and health risks. Concern in the past, however, related primarily to the fact, as the 1927 Natural Gas Handbook noted, “gas leaking into the atmosphere means a continual loss in money,” although gas explosions were also an issue.26
Methane leakage was an especially serious problem in natural gas fields located near and in residential areas such as McKeesport and Versailles. The worst problems in regard to methane leakage occurred in the post-World War II period. Many well bores that were never properly plugged had been covered by structures or filled by landowners. In addition, scavengers removed many casings to sell as scrap metal and methane leaked into structures, creating air pollution and explosion hazards. In 2005, problems with methane leakage in Versailles resulted in Congressman Mike Doyle securing federal funding for an investigation by the National Energy Technology Laboratory (NETL). The NETL report identified three types of abandoned wells at the Versailles site: wells never cased; wells with only surface conductors left; and wells with the surface conductors and some casing remaining. The NETL researchers performed geophysical surveys using seismic and magnetic technologies, performed gas analyses from existing vents and wells, and searched for unknown gas leaks and hidden wells. They concluded that “improper well abandonment for many of the 175 [Versailles] gas wells drilled in the Borough provides a mechanism of migration for stray gas detected at the surface.”27 The report concluded with a number of recommendations for identifying gas leaks and remediating them. The NETL investigators, however, only examined the sites of the 175 Versailles wellbores although NETL also estimate that over 1,000 wells were drilled in the McKeesport field. The remainder of the well sites have been left for future study.
The third lesson from McKeesport relevant to the current natural gas boom is that insufficient regulatory enforcement may result in enduring environmental hazards. The myopic behavior so pervasive during the boom fundamentally neglects future impacts, either financial (as demonstrated above) or environmental. The result is a future stream of costs ultimately reflected in suppressed property values, required mitigation measures, and non-pecuniary effects. Again, the issue here is an externality produced by extraction; in this case an intertemporal externality rather than the contemporaneous externality of depressurization raised earlier. The regulatory role, then, is a common one: to mitigate the harmful effects on third parties produced by the actions of self-interested market participants.
In the current context, where extraction has evolved from vertical to horizontal drilling and the use of hydraulic fracturing, leakage rates remain a concern. Given the magnitude of natural gas production in the 21st century, the ramifications of leakage are global in reach. Further, the enduring effects of gas field development and production on water quality, disturbances from new rights of way, and ecosystem fragmentation pose significant costs to affected communities. Though the scope and techniques have changed from the McKeesport era to the present, the clear role for regulatory management of externalities remains.
Back to topConclusions
This paper argues that natural resource extraction cycles, which often follow a boom-and-bust pattern, should be regulated. The justification for government intervention stems from two areas. First, there are contemporaneous externalities from pool depressurization and potentially long lasting externalities from environmental damage. Second, the irrationality that seemingly grips market participants yields over-investment and, hence, waste of productive labor and capital. The McKeesport experience highlights both in hyperbolic fashion. Our fixed cost estimates conservatively suggest investment exceeded revenue by nearly a factor of five. This omits variable costs, losses to some shareholders, and the value of leaked gas. Thus, the inefficiency in McKeesport was likely many times greater. Our newly digitized data reveals new wells were drilled when the expected payback period approached ten years. Further, these data show that investors interpreted failed wells as a signal to drill more, expecting the next great strike to be around the corner.
What does McKeesport potentially convey to the present gas boom in the U.S.? We distill three central lessons that are pertinent to current situation. First, large initial returns may induce irrational behavior leading to inefficient outcomes. In the present, this pertains to both firms and private lessors who contract with drillers, allowing extraction on their land holdings with anticipated returns in the form of royalties. Second, unmanaged extraction in dense urban or suburban areas is especially likely to cause inefficient investment and significant external cost. Fortunately, the current boom is focused in rural and ex-urban areas.28 And third, sub-optimal oversight will generate long-term environmental degradation. Today the focus is on local air pollution, water quality impacts, and the contribution to long-term climatic change. Each of these aspects of the McKeesport experience may inform how firms, communities, and regulators choose to act in the present phase of the natural resource extraction cycle.
- 1. See, “Fracking in Pennsylvania”, Ballotpedia, Digital Encyclopedia of American Politics and Elections. URL: https://ballotpedia.org/Fracking_in_Pennsylvania.
- 2. Joel A. Tarr, Karen Clay, “Boom and Bust in Pittsburgh Natural Gas History: Development, Policy, and Environmental Effects 1878-1920”, Pennsylvania Magazine of History and Biography, vol. 139, 2015.
- 3. Pennsylvania Topographic and Geologic Survey Commission, Oil and Gas Map of Southwestern Pennsylvania. 1915 (Harrisburg, Pa: Wm. Stanley Ray, State Printer, 1916), 16-18.
- 4. Meredith E. Johnson, Geology and Mineral Resources of the Pittsburgh Quadrangle [hereafter cited as Johnson, Pittsburgh Quadrangle]. Pennsylvania Geological Survey Atlas of Pennsylvania, n°27 (Harrisburg, Pennsylvania: Bureau of Topographic and Geological Survey, 1929).
- 5. Johnson, Pittsburgh Quadrangle, 120-123.
- 6. A.M.T., L.B. & J.J.M, “McKeesport Gas Field Snake Hollow District, May 12, 1920”, (Harrisburg: Bureau of Topographic and Geological Survey, mimeo).
- 7. Johnson, Pittsburgh Quadrangle, 123.
- 8. Samuel S. Wyer [Chief Natural Gas Conservation, U.S. Fuel Administration], Present and Prospective Supply of Natural Gas Available in Pennsylvania (Washington DC: Dec. 28, 1918), 3-4.
- 9. William A. White, “McKeesport - A City Aflame”, Collier’s Magazine, vol. 65, Mar. 27, 1920, 15.
- 10. Pittsburgh Post-Gazette, April 4, 1920.
- 11. J. French Robinson, “Production of the McKeesport Gas Pool”, Natural Gas, vol. 2, 1921, 3-6.
- 12. Johnson, Pittsburgh Quadrangle, 131.
- 13. George H. Ashley, “Development and Probable Life of Gas Pool at McKeesport, Pennsylvania”, Bulletin n°3, Bureau of Topographic and Geological Survey, Harrisburg, Pennsylvania 1919, 3.
- 14. Johnson, Pittsburgh Quadrangle, 127.
- 15. “McKeesport’s Gas Spectre”, Gas Age, Jan. 25, 1921, 65.
- 16. George H. Ashley, “Decline of McKeesport Gas Pool”, Bulletin n°4, Pennsylvania Bureau of Topographic and Geologic Survey, Harrisburg, Pennsylvania, December 26, 1919; George H. Ashley, “Decline of McKeesport Gas Pool”, Bulletin n°4, Pennsylvania Bureau of Topographic and Geologic Survey, Harrisburg, Jan. 12. 1920, rev. June 1922. These are consecutive Bulletins issued by the Pennsylvania Bureau of Topographic and Geologic Survey each with a title and date, as indicated.
- 17. George H. Ashley, “The McKeesport Gas Pool Allegheny County, Pennsylvania”, Bulletin n°5, Pennsylvania Bureau of Topographic and Geological Survey, Harrisburg, Jan. 12. 1920, rev. June 1922, 4.
- 18. “Antagonism to State Geologist,” The Gas Age, 1920, 234.
- 19. Ibid.
- 20. George H. Ashley, “The McKeesport Gas Pool Allegheny County, Pennsylvania”, Bulletin n°5, Bureau of Topographic and Geological Survey, Harrisburg, Pennsylvania, Jan. 12 1920, rev. June 1922.
- 21. Real Estate Statistics for Allegheny County, Pennsylvania Base Book, 1936 (Pittsburgh, Pennsylvania: University of Pittsburgh Press, 1936), 10; George H. Ashley, J. French Robinson, The Oil and Gas Fields of Pennsylvania (Harrisburg: Bureau of Topographic and Geological Survey, 1922), 66. A striking example of excessive subdivision of the land and drilling for oil on small plots with disastrous results was in Galicia in the 1870s and 1880s. See Alison Fleig Frank, Oil Empire: Visions of Prosperity in Austrian Galicia (Cambridge: Harvard University Press, 2005), 61-68.
- 22. Terence Daintith, Finders Keepers? How the Law of Capture Shaped the World Oil Industry (London: Routledge, 2010), 3-50, 411-438; Pifer Ross H, “The Rule of Capture in Pennsylvania Oil and Gas Law”, PPT Presentation. URL: https://pennstatelaw.psu.edu/_file/aglaw/Rule_of_Capture_in_Pennsylvani…
- 23. George H. Ashley, “The McKeesport Gas Pool Allegheny County, Pennsylvania”, Bulletin n°5, Bureau of Topographic and Geological Survey, Harrisburg, Pennsylvania, Jan. 12, 1920, rev. June 1922, 6.
- 24. Tarr, Clay, “Boom and Bust in Pittsburgh Natural Gas History”.
- 25. Johnson, Pittsburgh Quadrangle, 129. A document in the archives of the Pennsylvania Geological Survey, located in Pittsburgh, entitled, “Plugging of Wells in McKeesport Gas Field”, lists approximately 500 wells that were plugged mainly in 1920. The entries for each well include information such as the name of the well owner or lessee, the name of the plugger, the date of the plugging, the depth of the well, and some information about casing. There is no information on the document about who compiled it but is can be assumed that the Pennsylvania Geological Survey collected and compiled the information.
- 26. Ramón A. Alvarez, et al. “Assessment of Methane Emissions from the U.S. Oil and Gas Supply Chain”, Science, vol. 361, n° 6398, 2018; John C. Diehl, Natural Gas Handbook (Erie, Pa: Metric Metal Works, 1929), 330.
- 27. National Energy Technology Laboratory, Methane Emissions Project Borough of Versailles, Pennsylvania Final Report (Pittsburgh, Pa: National Energy Technology Laboratory, 2007).
- 28. Erin N. Mayfield, et al., “Cumulative Air, Climate, and Employment Impacts of Natural Gas Systems”, Analysis: Nature Sustainability, vol. 2, 2019,
Archival Sources:
Pennsylvania Geological Survey, “Plugging of Wells in McKeesport Gas Field”, Pennsylvania Geological Survey Archives, Pittsburgh.
Published Sources:
“Fracking in Pennsylvania”, Ballotpedia, Digital Encyclopedia of American Politics and Elections. URL: https://ballotpedia.org/Fracking_in_Pennsylvania
Alvarez Ramón A. et al., “Assessment of Methane Emissions from the U.S. Oil and Gas Supply Chain”, Science. vol. 361, n° 6398, 2018, 186-188. DOI: 10.1126/science.aar7204
A.M.T., L.B. & J.J.M, “McKeesport Gas Field Snake Hollow District, May 12, 1920” (Harrisburg: Bureau of Topographic and Geological Survey, mimeo).
Ashley George H., “Development and Probable Life of Gas Pool at McKeesport, Pennsylvania”, Bulletin n°3, Pennsylvania Bureau of Topographic and Geological Survey, Harrisburg, 1919, 3.
Ashley George H., “Decline of McKeesport Gas Pool”, Bulletin n°4, Pennsylvania Bureau of Topographic and Geologic Survey, Harrisburg, December 26, 1919, 1-3.
Ashley George H., “Decline of McKeesport Gas Pool”, Bulletin n°4, Pennsylvania Bureau of Topographic and Geologic Survey, Harrisburg, Jan. 12 1920, rev. June 1922.
Ashley, G. H. “The McKeesport Gas Pool Allegheny County, Pennsylvania”, Bulletin n°5, Pennsylvania Bureau of Topographic and Geological Survey, Harrisburg, Jan. 12 1920, rev. June 1922, 4.
Ashley George H. and J. French Robinson, The Oil and Gas Fields of Pennsylvania. (Harrisburg: Bureau of Topographic and Geological Survey, 1922).
Daintith Terence, Finders Keepers? How the Law of Capture Shaped the World Oil Industry (London: Routledge, 2010).
Diehl John C., Natural Gas Handbook (Erie, Pennsylvania: Metric Metal Works, 1927).
Fleig Frank Alison, Oil Empire: Visions of Prosperity in Austrian Galicia (Cambridge: Harvard University Press, 2005).
Jennings E. C., “Use Caution in Investments”, The Gas Age, 1920, 86-87.
Jennings E. C., “Newton Gets the Gas Fever”, The Gas Age, 1920, 130.
Johnson Meredith E., Geology and Mineral Resources of the Pittsburgh Quadrangle. Pennsylvania Geological Survey Atlas of Pennsylvania, n°27 (Harrisburg, Pennsylvania: Bureau of Topographic and Geological Survey, 1929).
“McKeesport’s Gas Spectre”, The Gas Age, Jan. 25, 1924, 65.
Mayfield Erin N., Jared L. Cohon, Nicholas Z. Muller, Ines M.L. Azevedo and Allen L. Robinson, “Cumulative Air, Climate, and Employment Impacts of Natural Gas Systems”, Analysis: Nature Sustainability, vol. 2, 2019, 1123-1131.
Methane Emissions Project Borough of Versailles, Pennsylvania (National Energy Technology Laboratory, technical report, 2007). DOI: 10.13140/2.1.5069.8568
Pennsylvania Topographic and Geologic Survey Commission, Oil and Gas Map of Southwestern Pennsylvania, 1915 (Harrisburg, Pennsylvania: Wm. Stanley Ray, State Printer, 1916).
Pittsburgh Post-Gazette, April 4, 1920.
Real Estate Statistics for Allegheny County, Pennsylvania Base Book (Pittsburgh: University of Pittsburgh Press, 1936).
Robinson J. French, “Production of the McKeesport Gas Pool”, Natural Gas, 1921, vol. 2/2, 3-6.
Tarr Joel A., Karen Clay, “Pittsburgh as an Energy Capital”, in Joseph A. Pratt, Martin V. Melosi, and Kathleen A. Brosnan (eds), Energy Capitals: Local Impact, Global Influence (University of Pittsburgh Press: Pittsburgh, 2014).
Tarr Joel A., Karen Clay, “Boom and Bust in Pittsburgh Natural Gas History: Development, Policy, and Environmental Effects 1878-1920”, The Pennsylvania Magazine of History and Biography, vol. cxxxix, n°3, 2015, 321-341.
Whaples David A., Natural Gas Industry in Appalachia: A History from the First Discovery to the Maturity of the Industry (Jefferson, NC: McFarland & Company, 2005).
White William A., “McKeesport - A City Aflame”, Collier’s Magazine, vol. 65, 27 March 1920, 15.
Wyer Samuel S., Present and Prospective Supply of Natural Gas Available in Pennsylvania (Washington DC: Dec. 28, 1918).
Pifer Ross H, “The Rule of Capture in Pennsylvania Oil and Gas Law”, PPT Presentation. URL: https://pennstatelaw.psu.edu/_file/aglaw/Rule_of_Capture_in_Pennsylvania_Oil_and_Gas_Law.pdf.